
Investment Weekly: Debasement in the basement?

13 July 2026
Key takeaways
-
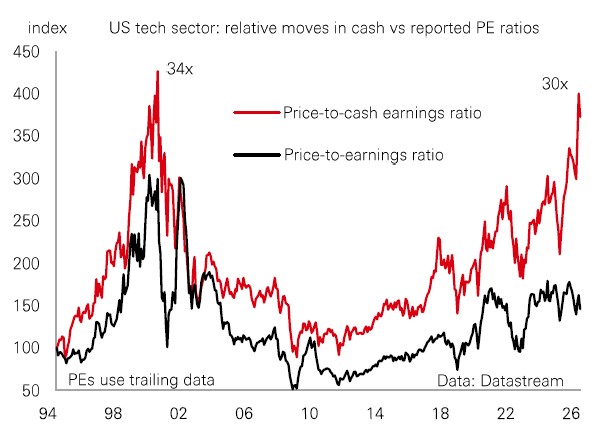
At first glance, tech stocks don’t appear overly expensive. Their 12-month forward price-to-earnings (PE) ratio sits at 22.5x – well below last October’s levels of 30x and the bubble-era levels of 2000. Today’s modest PE ratio reflects surging earnings that have outpaced index prices.
-
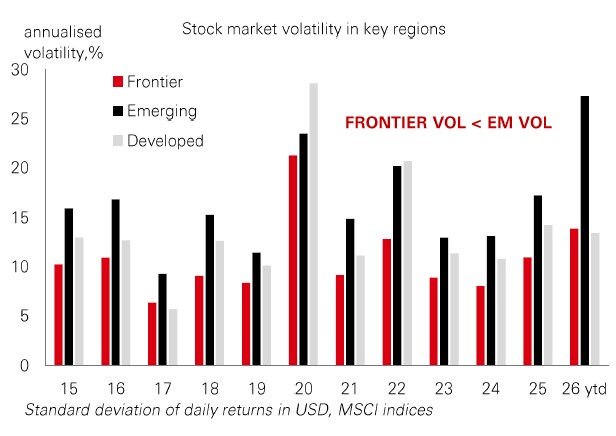
Frontier markets performed well in H1 2026, with the MSCI Select Frontier & Emerging Markets Capped Index up 14%. While this lagged broader EM performance – reflecting the impact of the US-Iran conflict on GCC markets and lower exposure to the AI-led rally – Frontier markets appeared less volatile.
-
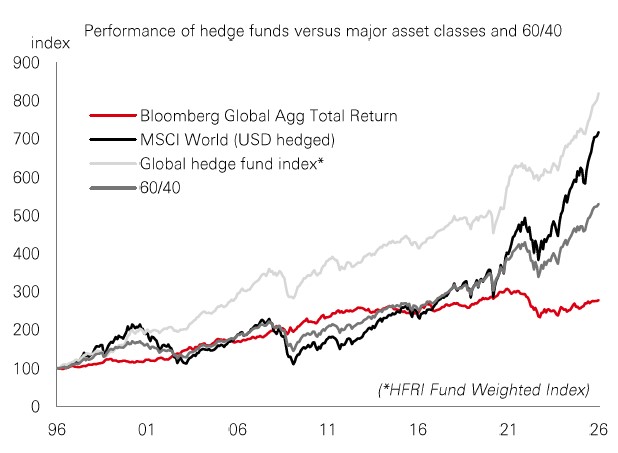
In the first half of 2026, a complex macro and market backdrop once again challenged the assumption that bonds provide reliable diversification during periods of equity volatility. It’s no surprise, then, that investors are looking for alternative ways to build more resilient portfolios.
Chart of the week – Debasement in the basement?
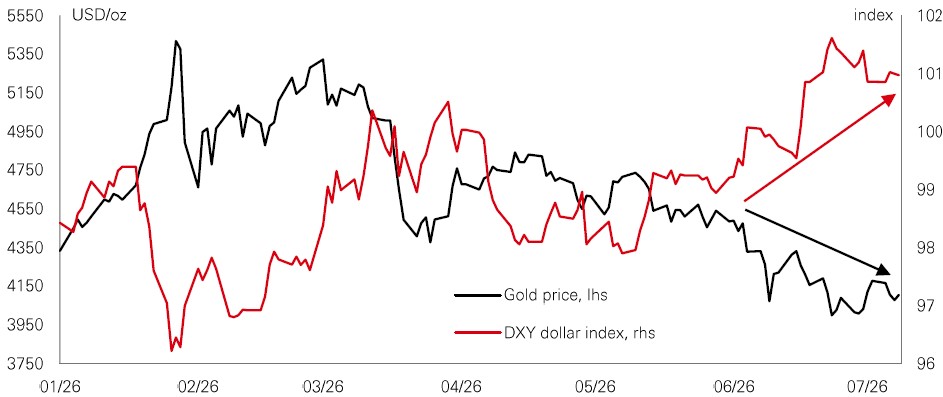
Is the debasement trade heading for the basement? It’s been dollar up and gold down in 2026 so far, and that is naturally leading to questions about whether the “debasement trade” – of a weaker dollar and stronger gold – is over.
The reality is that we’re in a world of “deficits forever”, with G7 governments pursuing active fiscal policy. The macro regime is what we call “two shocks and a boom”: a set-up where supply shocks create a spikier inflation profile, even if the CPI trend doesn’t look scary every month.
That plays into the strategic case for gold, where the story isn’t just higher prices, but also policy uncertainty, fiscal dominance risk, and inflation spikiness. However, hedging with the “barbarous relic” now comes with much higher volatility than many investors have been used to.
Meanwhile, dollar strength assumes a more hawkish Federal Reserve. Markets are priced for hawkishness, but the signalling framework has shifted: less forward guidance and more discretion. “Backward guidance” refers to policy reacting to data and data inferences, not promises.
Markets don’t move in straight lines. Over the medium term, the focus should remain on the macro fundamentals.
Market Spotlight
Complexity pays
CLOs – or collateralised loan obligations – can sound complicated. In fact, they’re a liquid asset class that can even come with a “complexity premium” (an additional yield). Yet the idea is straightforward: take a broad pool of corporate loans and package the cash flows into different layers of risk, allowing investors to pick their risk point.
Given the prospect of higher-for-longer rates, the floating rate nature of CLOs is likely to reinforce their appeal. Some securitised credit specialists see several other demand drivers:
First, CLOs offer a yield premium over similarly rated corporate bonds, with spreads attractive at every risk point relative to corporate credit. Second, credit quality remains resilient: loan defaults remain low at ~1.5%, which is well below long-term averages of 3.0%-4.0%. Third, CLO manager selection is critical, with experienced managers able to adjust portfolios, avoid weaker sectors, and improve risk-adjusted returns. Lastly, CLOs benefit from credit enhancement, which provides a structural cushion against losses, particularly for higher-rated bonds. Nevertheless, their risks should not be ignored.
The value of investments and any income from them can go down as well as up and investors may not get back the amount originally invested. The level of yield is not guaranteed and may rise or fall in the future. Past performance does not predict future returns. For informational purposes only and should not be construed as a recommendation to invest in the specific country, product, strategy, sector, or security. Diversification does not ensure a profit or protect against loss. Any views expressed were held at the time of preparation and are subject to change without notice. Any forecast, projection or target where provided is indicative only and is not guaranteed in any way. Index returns assume reinvestment of all distributions and do not reflect fees or expenses. You cannot invest directly in an index. Source: HSBC Asset Management, Factset, Bloomberg, Macrobond. Data as at 7.30am UK time 10 July 2026.
Lens on…
Earnings up, cash down
At first glance, tech stocks don’t appear overly expensive. Their 12-month forward price-to-earnings (PE) ratio sits at 22.5x – well below last October’s levels of 30x and the bubble-era levels of 2000. Today’s modest PE ratio reflects surging earnings that have outpaced index prices. One factor is the huge capex by hyperscalers, which is driving exceptional profits in tech hardware. It echoes the late ‘90s, when the telecoms sector poured billions into fibre to chase the internet boom. Crucially, reported earnings are not the same as cash flow. Earnings are subject to accounting adjustments, and because capex is depreciated through earnings over several years, current earnings per share (EPS) are flattered. Cash flow, however, takes an immediate hit when the capital is spent. This helps explain the divergence between cash and earnings PE ratios. |
While AI capex may pay off over time, today’s spending can weigh on future reported earnings if anticipated growth disappoints or, worse, rapid obsolescence sets in.
Frontier as a volatility dampener
Frontier markets performed well in H1 2026, with the MSCI Select Frontier & Emerging Markets Capped Index up 14%. While this lagged broader EM performance – reflecting the impact of the US-Iran conflict on GCC markets and lower exposure to the AI-led rally – Frontier markets appeared less volatile. While EM gains have been concentrated in South Korea and Taiwan, and are increasingly tied to AI-related sentiment, Frontier market returns were broad-based, with solid gains across the benchmark, including Egypt, Kazakhstan, and select central European constituents. Valuations also look eye catching. The Frontier benchmark trades at around 12x PE versus 19x for EM, a discount that doesn’t accurately reflect its growth or earnings prospects. Frontier markets still exhibit world-leading GDP growth rates and are expected to deliver 15%-20% earnings growth this year. |
The key first half takeaway is that Frontier markets have lived up to their low volatility track record. They continue to offer discounted valuations, strong earnings momentum and differentiated return drivers.
Cutting hedge
In the first half of 2026, a complex macro and market backdrop once again challenged the assumption that bonds provide reliable diversification during periods of equity volatility. It’s no surprise, then, that investors are looking for alternative ways to build more resilient portfolios. With the correlation between stocks and bonds generally turning positive in the 2020s, hedge funds have come to the fore as a complement – or partial substitute – for bonds, having historically delivered lower volatility, stronger returns and fewer drawdowns than a 60/40 portfolio. Some hedge funds specialists highlight three fund strategies that are well-positioned to perform in the current environment: 1) global macro managers may benefit from elevated rates, geopolitical fragmentation, and volatility; 2) equity long/short managers may be well placed to exploit stock market dispersion, particularly in Asia, given cheaper relative valuations; and 3) multi-strategy managers excel in complex environments, given their scale, diversification and ability to adjust allocations quickly across styles. |
As investors search for portfolio resilience, select hedge fund strategies can help “diversify the diversifiers”.
Past performance does not predict future returns. The level of yield is not guaranteed and may rise or fall in the future. For informational purposes only and should not be construed as a recommendation to invest in the specific country, product, strategy, sector, or security. Diversification does not ensure a profit or protect against loss. Any views expressed were held at the time of preparation and are subject to change without notice. Index returns assume reinvestment of all distributions and do not reflect fees or expenses. You cannot invest directly in an index. Any forecast, projection or target where provided is indicative only and is not guaranteed in any way. Costs may vary with fluctuations in the exchange rate. Source: HSBC Asset Management. Macrobond, Bloomberg, Refinitiv, FactSet. Data as at 7.30am UK time 10 July 2026.
Key Events and Data Releases
Last week

This week

For informational purposes only and should not be construed as a recommendation to invest in the specific country, product, strategy, sector or security. Any views expressed were held at the time of preparation and are subject to change without notice. Any forecast, projection or target where provided is indicative only and is not guaranteed in any way. Index returns assume reinvestment of all distributions and do not reflect fees or expenses. You cannot invest directly in an index. Source: HSBC Asset Management. Data as at 7.30am UK time 10 July 2026.
Market review
Global equities came under pressure as oil prices rose amid renewed geopolitical tensions in the Middle East. In the US, major indices traded without clear direction ahead of the Q2 earnings season: the S&P 500 and Nasdaq advanced as semiconductor shares rebounded, while the Dow Jones Industrial Average slipped and the small-cap Russell 2000 was broadly flat. European bourses fell across the board, while Asian equities were mixed. The Hang Seng led regional gains, while the Nikkei 225 declined and the Kospi extended its pullback in choppy trading amid concerns about the durability of the AI-led tech rally. In rates, higher oil prices rekindled global inflation worries, prompting a modest bear-steepening in the US Treasury curve and a broad rise in European sovereign yields. In FX, most major currencies strengthened against the US dollar.
Share


Explore ways to invest
Related Insights


Disclaimer
We’re not trying to sell you any products or services, we’re just sharing information. This information isn’t tailored for you. It’s important you consider a range of factors when making investment decisions, and if you need help, speak to a financial adviser.
As with all investments, historical data shouldn’t be taken as an indication of future performance. We can’t be held responsible for any financial decisions you make because of this information. Investing comes with risks, and there’s a chance you might not get back as much as you put in.
This document provides you with information about markets or economic events. We use publicly available information, which we believe is reliable but we haven’t verified the information so we can’t guarantee its accuracy.
This document belongs to HSBC. You shouldn’t copy, store or share any information in it unless you have written permission from us.
We’ll never share this document in a country where it’s illegal.
This document is prepared by, or on behalf of, HSBC UK Bank Plc, which is owned by HSBC Holdings plc. HSBC’s corporate address is 1 Centenary Square, Birmingham BI IHQ United Kingdom. HSBC UK is governed by the laws of England and Wales. We’re authorised by the Prudential Regulation Authority (PRA) and regulated by the Financial Conduct Authority (FCA) and the PRA. Our firm reference number is 765112 and our company registration number is 9928412.