
19 May 2025
Is it deal-done and crisis-averted in investment markets? Last week’s agreement between the US and China to slash tariffs for at least the next 90 days is the strongest marker yet of a shift to policy de-escalation. In truth, investors have been alert to this theme since the market recovery began in the third week of April. But last week’s price action takes US stocks decisively above their “Liberation Day” levels.
Market price moves naturally reflect a shift in investors’ assessment of the risks: lower probabilities now on bad outcomes, and higher probabilities on better outcomes. Even so, it still looks like average US tariffs will settle in the low teens, the highest rate we’ve seen in the post-war period. Macro damage has already been done. And the policy outlook remains ultra-uncertain. An important theme this year has been the dramatic rotation of the market narrative. The theme has moved from a universal belief in US exceptionalism in January to a US policy induced recession and worries about economic fragmentation in early April. Now it looks like something in-between. Markets will continue to spin-around.
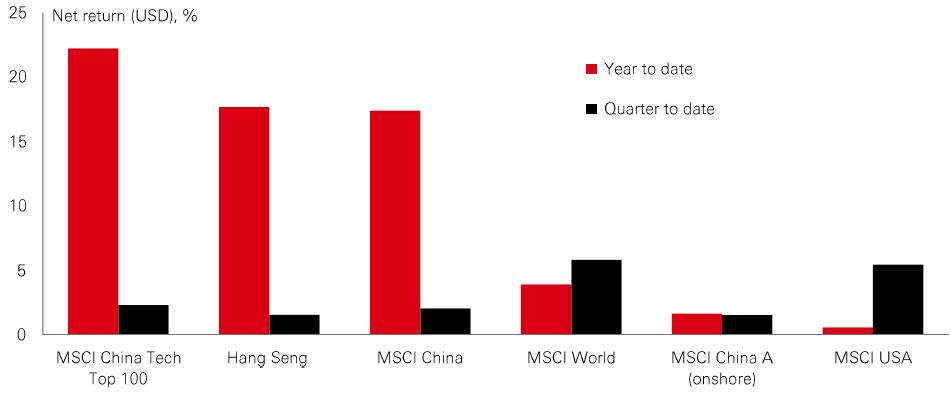
As for China, the US talks followed a new round of policy stimulus – including rate cuts, targeted easing, credit support, and support for financial markets. Chinese offshore indices have performed well in 2025 driven by strong returns in technology stocks, which continue to be a profit engine, with firms capitalising on DeepSeek-driven AI optimism. By contrast, onshore indices have been weaker, due to lower tech exposures and slightly higher valuations.
With the Eurovision Song Contest beaming live from Basel to living rooms around the world last weekend, we bring other news from Europe – but this time on proposed developments in the bond market. Recent questions over the safe-haven status of US Treasuries have been a reminder that investors face limited substitutes given that Europe's fragmented debt markets fail to offer the depth and liquidity necessary to rival Treasuries. Moreover, structural imbalances between eurozone economies cause destabilising capital flows between “core” and “periphery” nations during stress periods.
The proposal for European Safe Bonds (ESBies) offers a potential solution. In technical-speak, ESBies are the senior tranche of a securitisation vehicle backed by a diversified portfolio of eurozone sovereign bonds, with the junior tranche referred to as European Junior Bonds, or EJBies. They would command enhanced safe-haven premiums through cross-European risk pooling – signalling more market cohesion and serving as a risk-free alternative to German Bunds. They could represent a way of increasing systemic resilience, while addressing the global safe asset shortage and over-reliance on the dollar – just as US exceptionalism as the sole provider of safety is under scrutiny.
The value of investments and any income from them can go down as well as up and investors may not get back the amount originally invested. Past performance does not predict future returns. The level of yield is not guaranteed and may rise or fall in the future. For informational purposes only and should not be construed as a recommendation to invest in the specific country, product, strategy, sector, or security. Diversification does not ensure a profit or protect against loss. Any views expressed were held at the time of preparation and are subject to change without notice. Any forecast, projection or target where provided is indicative only and is not guaranteed in any way. Source: HSBC Asset Management, Bloomberg. Data as at 7.30am UK time 16 May 2025.
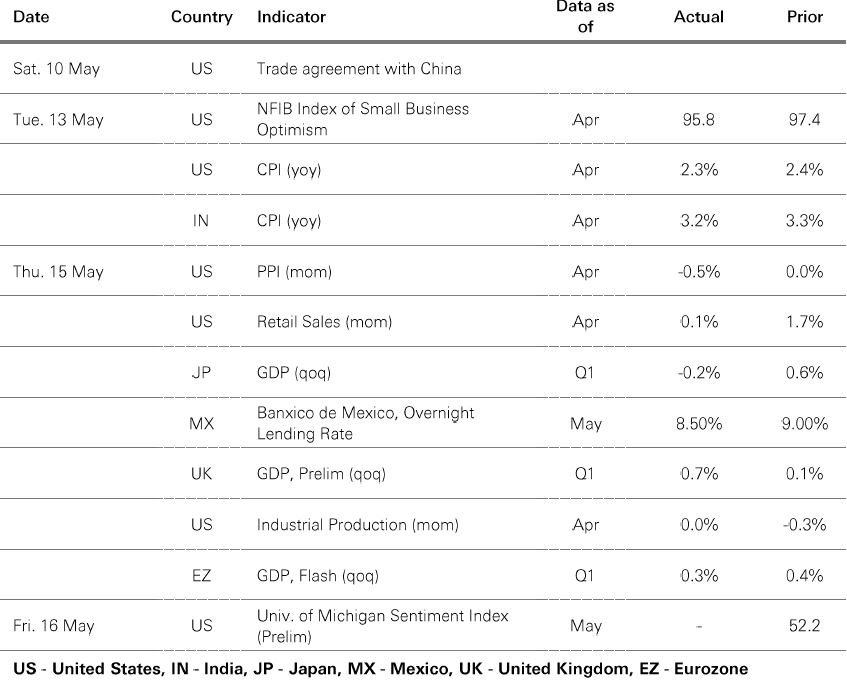
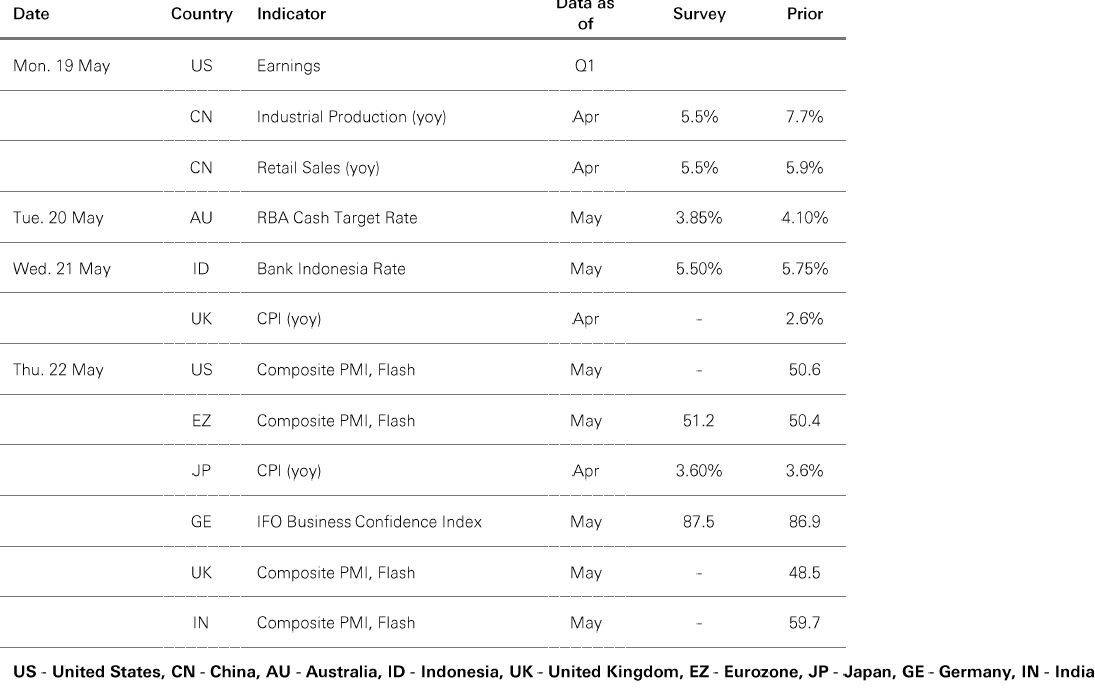
The past week saw the US and China agree to substantially reduce tariffs for a 90-day period while working towards a deal. Although clearly positive news, the significant changes in tariff policy since early April are likely to make interpreting macro data tricky in the coming months. The lion’s share of survey data – aka “soft data” – for April weakened on the back of “Liberation Day”. But May is likely to see some recovery, especially in the context of resurgent US equities. |
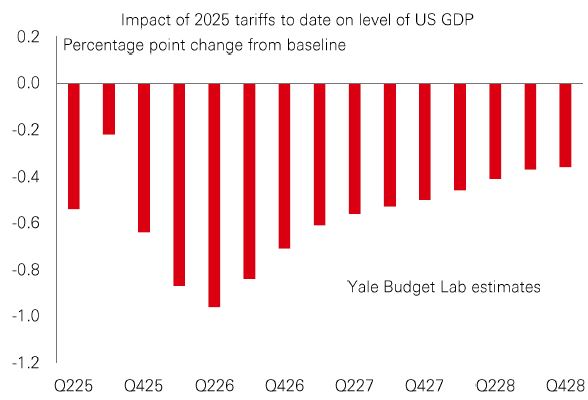
However, it is worth taking a step back and remembering that even after the thawing of US-China trade relations, the average effective US import tariff has still risen to a post-WWII high. Accordingly, macro models suggest US growth will drop well below trend in the coming quarters. Hence, while “soft” data may stage a recovery, “hard” data are likely to weaken, especially given investment and consumer spending was pulled into Q1 to avoid paying tariffs, likely leaving an “air pocket” in Q2. In the absence of further positive policy news, weaker “hard” data could trigger some renewed volatility in risk markets.
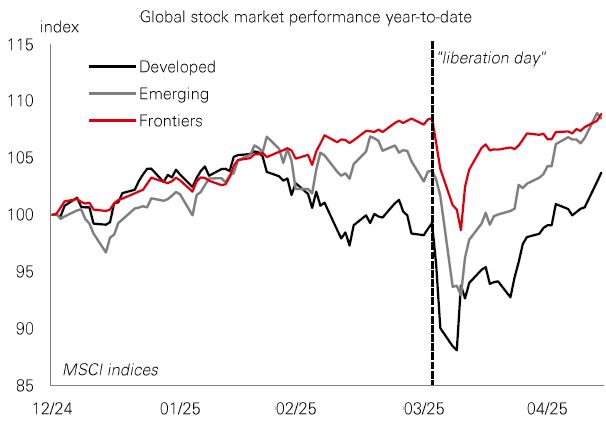
When the US government announced plans for reciprocal tariffs in early April, the initial 46% levy on Vietnam (later cut to 10% while trade talks continue) made it one of the worst affected countries. As a fast-growing Frontier manufacturing hub, Vietnam’s goods trade surplus with the US has soared in recent years (2024: USD123.5 billion). That’s been driven by its popularity with western firms pursuing a “China Plus One” strategy of diversifying their supply chains. Like other Frontier markets, ultra-high trade policy uncertainty has caused volatility in Vietnamese stocks. But the market has rebounded well, and year-to-date Frontiers as a group have returned 8.9%, outperforming both developed (3.7%) and emerging (8.5%) markets. |
This positive performance is down to factors including discounted valuations, strong earnings growth, and local country idiosyncrasies that offer protection against macro pressures. In the case of Vietnam, foreign investment is expected to be sticky despite recent uncertainty, with the country’s expanding middle class, digital adoption, and urbanisation giving its economy structural resilience.
With market rotations continuing, there could be a case for investors to look beyond US large-cap dominance for upside in global small caps. The US S&P 600 small-cap index has lagged the S&P 500 by over 50% over the past decade. And while investors would be forgiven for losing patience by now, history suggests smaller firms can deliver big gains after spells out of favour. Take the 1993-2000 technology bubble. After a serious bout of small-cap neglect, the S&P small-cap index trounced the S&P 500 by 75% from 2001 to 2010. |
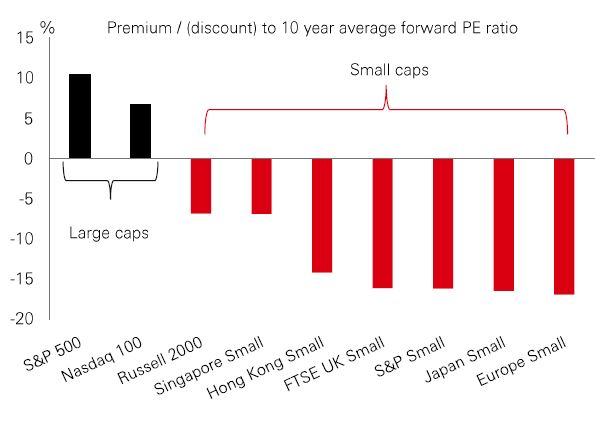
Small caps have a high beta to both local growth and borrowing. While 65% of US corporate borrowing comes from capital markets, it’s only 15-20% in Europe, making those firms more reliant on bank financing. Today, many global small-cap indices trade at a discount of close to 20% versus the last decade. Non-US small caps currently trade below their average 12-month forward PEs, with Hong Kong and UK small-cap PEs close to 10x – half the S&P 500’s 20.5x.
Past performance does not predict future returns. The level of yield is not guaranteed and may rise or fall in the future. For informational purposes only and should not be construed as a recommendation to invest in the specific country, product, strategy, sector, or security. Any views expressed were held at the time of preparation and are subject to change without notice. Index returns assume reinvestment of all distributions and do not reflect fees or expenses. You cannot invest directly in an index. Any forecast, projection or target where provided is indicative only and is not guaranteed in any way. HSBC Asset Management accepts no liability for any failure to meet such forecast, projection or target. Source: HSBC Asset Management. Macrobond, Bloomberg. Data as at 7.30am UK time 16 May 2025.
Source: HSBC Asset Management. Data as at 7.30am UK time 16 May 2025. For informational purposes only and should not be construed as a recommendation to invest in the specific country, product, strategy, sector or security. Any views expressed were held at the time of preparation and are subject to change without notice. Any forecast, projection or target where provided is indicative only and is not guaranteed in any way.
Risk-on market sentiment strengthened last week as the US and China agreed to reduce tariffs to 30% on Chinese imports, and 10% on US imports into China for a 90-day period. US markets now anticipate two rate cuts by year-end, down from nearly three the previous week. The US dollar continued its modest recovery, while US Treasuries declined, alongside similar yield rises in German Bunds and UK Gilts. US and eurozone credit spreads narrowed. US equities surged, driven by technology, with European markets following, supported by strong Q1 earnings in financials and healthcare. Japan's Nikkei 225 posted modest gains as the yen were range-bound. Other Asian indices performed well, led by India’s Sensex, followed by Hong Kong’s Hang Seng, China’s Shanghai composite, and South Korea's Kospi. In commodities, oil prices edged higher, whilst gold retreated from previous week’s gains.


We’re not trying to sell you any products or services, we’re just sharing information. This information isn’t tailored for you. It’s important you consider a range of factors when making investment decisions, and if you need help, speak to a financial adviser.
As with all investments, historical data shouldn’t be taken as an indication of future performance. We can’t be held responsible for any financial decisions you make because of this information. Investing comes with risks, and there’s a chance you might not get back as much as you put in.
This document provides you with information about markets or economic events. We use publicly available information, which we believe is reliable but we haven’t verified the information so we can’t guarantee its accuracy.
This document belongs to HSBC. You shouldn’t copy, store or share any information in it unless you have written permission from us.
We’ll never share this document in a country where it’s illegal.
This document is prepared by, or on behalf of, HSBC UK Bank Plc, which is owned by HSBC Holdings plc. HSBC’s corporate address is 1 Centenary Square, Birmingham BI IHQ United Kingdom. HSBC UK is governed by the laws of England and Wales. We’re authorised by the Prudential Regulation Authority (PRA) and regulated by the Financial Conduct Authority (FCA) and the PRA. Our firm reference number is 765112 and our company registration number is 9928412.


