
30 March 2026
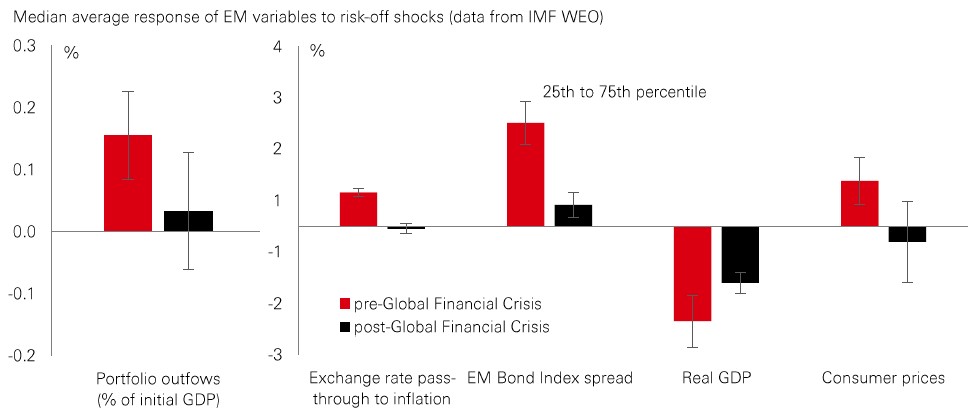
Emerging markets (EM) have proved remarkably resilient to the twin shocks of surging oil prices and a stronger US dollar – a combination that was once a recipe for widespread stress. This latest episode crystallises a long-building structural shift: some EM assets are becoming less sensitive to global “risk-off” events – including swings in the dollar.
The chart tells the story. Compared to the pre-Global Financial Crisis era, EM economies absorb stress much better today. Capital outflows are muted, currency weakness translates into less inflation, and the overall hit to growth is generally smaller. In other words, EM is acting less like a fragile, pro-cyclical bloc, and more like a set of economies anchored by stronger and more credible policy frameworks.
Divergence between countries is a big part of the story. Commodity exporters like Brazil and Colombia have benefitted from higher oil prices. Meanwhile, tech-heavy markets like South Korea and Taiwan continue to get support from global demand linked to AI. India is a big energy importer, but also benefits from a very strong structural growth story over the long term. This range of exposures helps smooth overall volatility, as weakness in some places can be offset by strength elsewhere.
Meanwhile, real yields in many emerging markets remain attractive versus developed markets and fiscal positions have generally strengthened. Together with improving central bank credibility, this is helping to anchor inflation expectations when external conditions become choppy. While country-specific risks haven’t disappeared, emerging markets increasingly look like a more diversified, higher-quality building block in global portfolios.
Surging energy prices have stalled past year’s defining market theme: the "broadening out" that recently delivered strong performance across emerging markets.
While ongoing energy disruptions will likely see US stocks and the dollar perform relatively well, a retreat in oil prices below the USD100 mark could quickly revive the broadening-out trade. That’s because the fundamental case for non-US markets remains intact. Global investors are materially under-allocated to the rest of the world, seemingly overlooking attractive valuations and increasingly resilient corporate balance sheets.
In emerging markets, for instance, analysts are now forecasting an impressive 30% profit growth for 2026. And while, the global forward P/E has climbed to an above-average 19x, that headline number masks a great deal of dispersion. After a 15-year run where the US outperformed the rest of the world by 350%, the valuation gap between US equities and their non-US counterparts is now more than double its long-run average.
Non-US markets which offer: 1) defensive AI growth, 2) low relative valuations and an improving profits outlook, and 3) exposure to dividend and shorter-duration strategies are likely to be key sources of diversification and portfolio resilience, as well as long-run returns.
The value of investments and any income from them can go down as well as up and investors may not get back the amount originally invested. Past performance does not predict future returns. The level of yield is not guaranteed and may rise or fall in the future. Past performance does not predict future returns. For informational purposes only and should not be construed as a recommendation to invest in the specific country, product, strategy, sector, or security. Diversification does not ensure a profit or protect against loss. Any views expressed were held at the time of preparation and are subject to change without notice. Any forecast, projection or target where provided is indicative only and is not guaranteed in any way. Source: HSBC Asset Management, Bloomberg, Macrobond. Data as at 7.30am UK time 27 March 2026.
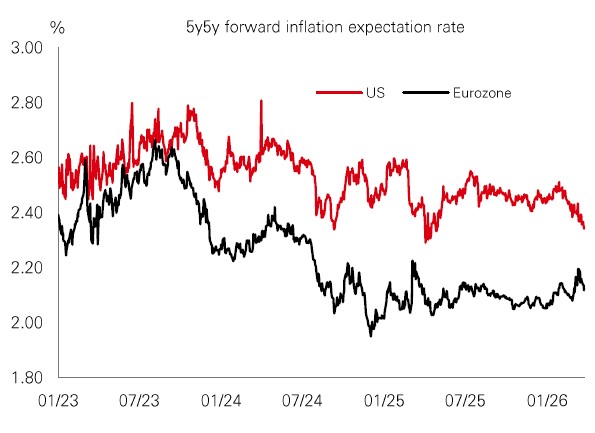
After the epic slog of getting post-pandemic inflation back towards target, Western central banks now have an oil shock on their hands. Tackling any inflation surge without crushing growth will be a delicate balancing act. |
The US Fed may have it easiest. Even with the oil spike, five-year, five-year inflation expectations (five-year average inflation, starting in five years’ time) have fallen. That should give it room to look through a near-term inflation bump, shoring up the jobs side of its dual mandate. The ECB’s sole mandate of delivering price stability means it has sounded more hawkish than the Fed. With its latest forecasts pointing to core inflation above 2% until at least 2028, it may well act. But well-behaved inflation expectations and downside growth risks mean it can probably tread carefully. The UK faces the toughest path, with above-target inflation, meaning the BoE is under pressure to tighten policy and rebuild credibility, but stagnant growth and the oil shock are set to hit demand amid a limited fiscal response.
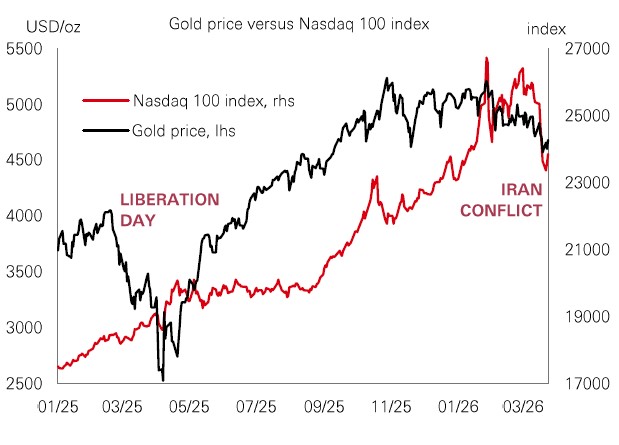
Moves in the gold price since the Iran conflict broke out have defied expectations. The conventional playbook assumed that mounting geopolitical tensions and economic uncertainty would naturally boost the yellow metal, mirroring last year’s “Liberation Day” episode and sustaining a spectacular two-year rally. Instead, reality has proved quite different, with gold registering a 15% month-to-date drawdown. A stronger US dollar has certainly been a headwind, deterring non-US buyers, while a hawkish repricing of interest rates has increased the opportunity cost of holding a non-yielding asset. Yet, gold withstood a similar surge in the greenback and rates throughout 2022, weakening this traditional thesis. Rather, gold is behaving like a risk asset in 2026. Ownership has shifted towards retail and other leveraged buyers, many of whom are forced to liquidate holdings in periods of market stress. |
There remains a decent long-term investment case for gold, particularly amid ongoing global de-dollarisation. However, the recent volatility offers a stark reminder: robust portfolio diversification demands a broad-based approach.
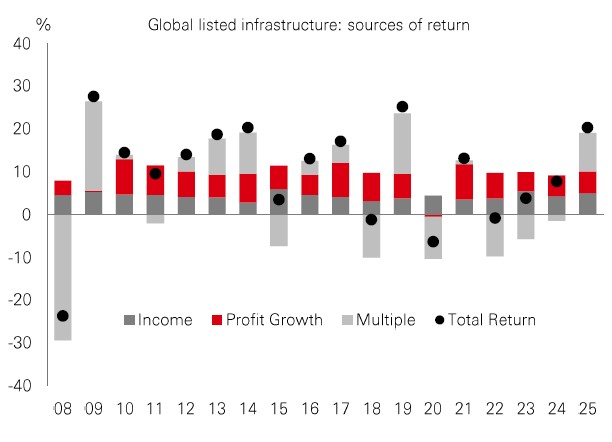
Stocks that do the heavy lifting in areas of major infrastructure – like AI data centres, energy transition, and transport networks – have been in demand this year, with listed infrastructure indices rising sharply. There are three main reasons for this. First, infrastructure stocks are the backbone of some powerful, long-term market themes, including the AI supercycle and demand for electricity. Second, they’ve been popular with investors amid the recent rotation from expensive US tech industries to more predictable asset-heavy sectors, like utilities and energy. Third, infrastructure is traditionally a more defensive area of the market and less sensitive to cyclical industry swings. Therefore, its dependable cashflows and dividends are potentially appealing against a backdrop of uncertainty and volatility elsewhere in the market, including in conventional havens like bonds and gold. |
Indeed, with infrastructure’s performance seeing a lower degree of association with both the tech sector and the wider market over the past three years, it is providing not only stable returns but also a source of diversification for portfolios.
Past performance does not predict future returns. The level of yield is not guaranteed and may rise or fall in the future. For informational purposes only and should not be construed as a recommendation to invest in the specific country, product, strategy, sector, or security. Diversification does not ensure a profit or protect against loss. Any views expressed were held at the time of preparation and are subject to change without notice. Index returns assume reinvestment of all distributions and do not reflect fees or expenses. You cannot invest directly in an index. Any forecast, projection or target where provided is indicative only and is not guaranteed in any way. Costs may vary with fluctuations in the exchange rate. Source: HSBC Asset Management. Macrobond, Bloomberg. Data as at 7.30am UK time 27 March 2026.


For informational purposes only and should not be construed as a recommendation to invest in the specific country, product, strategy, sector or security. Any views expressed were held at the time of preparation and are subject to change without notice. Any forecast, projection or target where provided is indicative only and is not guaranteed in any way. Source: HSBC Asset Management. Data as at 7.30am UK time 27 March 2026.
Global stocks remained volatile last week, but signs of stabilisation emerged after recent weakness. In developed markets, European indices were on track to finish higher, while US indices were mixed, with the small-cap Russell 2000 outperforming. In emerging markets, LatAm stocks led gains, while most EM Asian markets weakened, led by losses in Korean equities. In government bonds, the recent sharp rise in major sovereign yields eased, though US Treasury yields rose further over the week. In FX, the US dollar strengthened against a basket of major currencies. In oil markets, Brent crude held above USD100 a barrel, with elevated volatility and the Brent–WTI spread at its widest in over a decade. In precious metals, gold prices edged lower, extending recent declines.


We’re not trying to sell you any products or services, we’re just sharing information. This information isn’t tailored for you. It’s important you consider a range of factors when making investment decisions, and if you need help, speak to a financial adviser.
As with all investments, historical data shouldn’t be taken as an indication of future performance. We can’t be held responsible for any financial decisions you make because of this information. Investing comes with risks, and there’s a chance you might not get back as much as you put in.
This document provides you with information about markets or economic events. We use publicly available information, which we believe is reliable but we haven’t verified the information so we can’t guarantee its accuracy.
This document belongs to HSBC. You shouldn’t copy, store or share any information in it unless you have written permission from us.
We’ll never share this document in a country where it’s illegal.
This document is prepared by, or on behalf of, HSBC UK Bank Plc, which is owned by HSBC Holdings plc. HSBC’s corporate address is 1 Centenary Square, Birmingham BI IHQ United Kingdom. HSBC UK is governed by the laws of England and Wales. We’re authorised by the Prudential Regulation Authority (PRA) and regulated by the Financial Conduct Authority (FCA) and the PRA. Our firm reference number is 765112 and our company registration number is 9928412.

